DMS Talks
Location Analytics for Retail — With Frequency Measurement for Better Performance.
Insights in Sight: Location Analytics for Retail
With frequency measurement for better performance: location analytics deliver valuable insider knowledge about both the store location and its surrounding environment — helping you better understand visitor behavior.
That’s exactly what this DMS Talk is about: How can location analytics be effectively used in retail? Frequency measurement enables a deeper understanding of foot traffic and visitor patterns — the ideal foundation for targeted optimization strategies such as retail media. With data-driven insights from freely available mobile GPS data, retailers gain a real competitive edge. When combined with socio-demographic data, location analytics offer a complete overview — providing highly valuable insights for smarter, more effective retail decisions.
Please note: this DMS Talk is available in the German language only.
Transcript of the DMS Talk – For Reading
DMS Talk – Location Analytics
Oliver Nitz (CMO, Digitale Mediensysteme):
Welcome to our fifth DMS Talk – today on the topic of Location Analytics.
My name is Oliver Nitz, I’m CMO of Digitale Mediensysteme and your moderator today.
Feel free to participate in the chat if you’d like. Please type your name first, then your question – we’ll address it later in the session.
I’ve muted everyone just to make sure our guests’ presentations aren’t interrupted.
Our topic today: Location Analytics.
Brick-and-mortar retail is undergoing major transformation – not only since the pandemic but also due to structural changes and the growing pressure from e-commerce.
Retail chains are increasingly forced to look more closely at the performance of individual locations – and at the question of which new locations will make sense in the future.
Today, this can be answered with the help of data:
We can look at visitor frequency, movement patterns, and places of origin, link them with sociodemographic information, and derive purchasing power and target group potential.
That’s what we’ll explore today – complemented by sensors at entrances, in stores, at locations, and via beacons. These allow data to be collected and consolidated on site to answer specific business questions.
Let’s see – is Thomas already here? Yes?
Then please join me in welcoming Jan Barenhoff, joining us live from Cologne, Director of Business Development Europe at Placsense.
Placsense provides data-driven insights into customer behavior. We also work with them – very professionally and in a great partnership.
And please also welcome Thomas Hinterleitner, owner of Locationplace.
He runs a knowledge and innovation center for retail and supports companies in transforming their physical retail business. He’ll also show some case studies and projects today.
Our goal is to understand which use cases work, what questions clients are asking, and how data can provide answers.
Sometimes we’ll mention client names, sometimes not.
Thomas – why don’t you start by briefly introducing yourself and showing us what you’ve prepared? I’m looking forward to it.
Thank you in advance, and welcome!
Thomas Hinterleitner (Locationplace):
Hello everyone! Thank you very much for the invitation and the opportunity to talk about Location Analytics and share a few case studies.
I’ve prepared a PowerPoint presentation – one moment, I’ll share my screen … it should now be visible.
Introduction:
Our company – originally LBS GmbH, founded about nine years ago – has found its core focus in retail and has operated since 2014 as Locationplace GmbH.
I represent Austria as well as Central and Eastern Europe for our umbrella organization, the Location Based Marketing Association (LBMA).
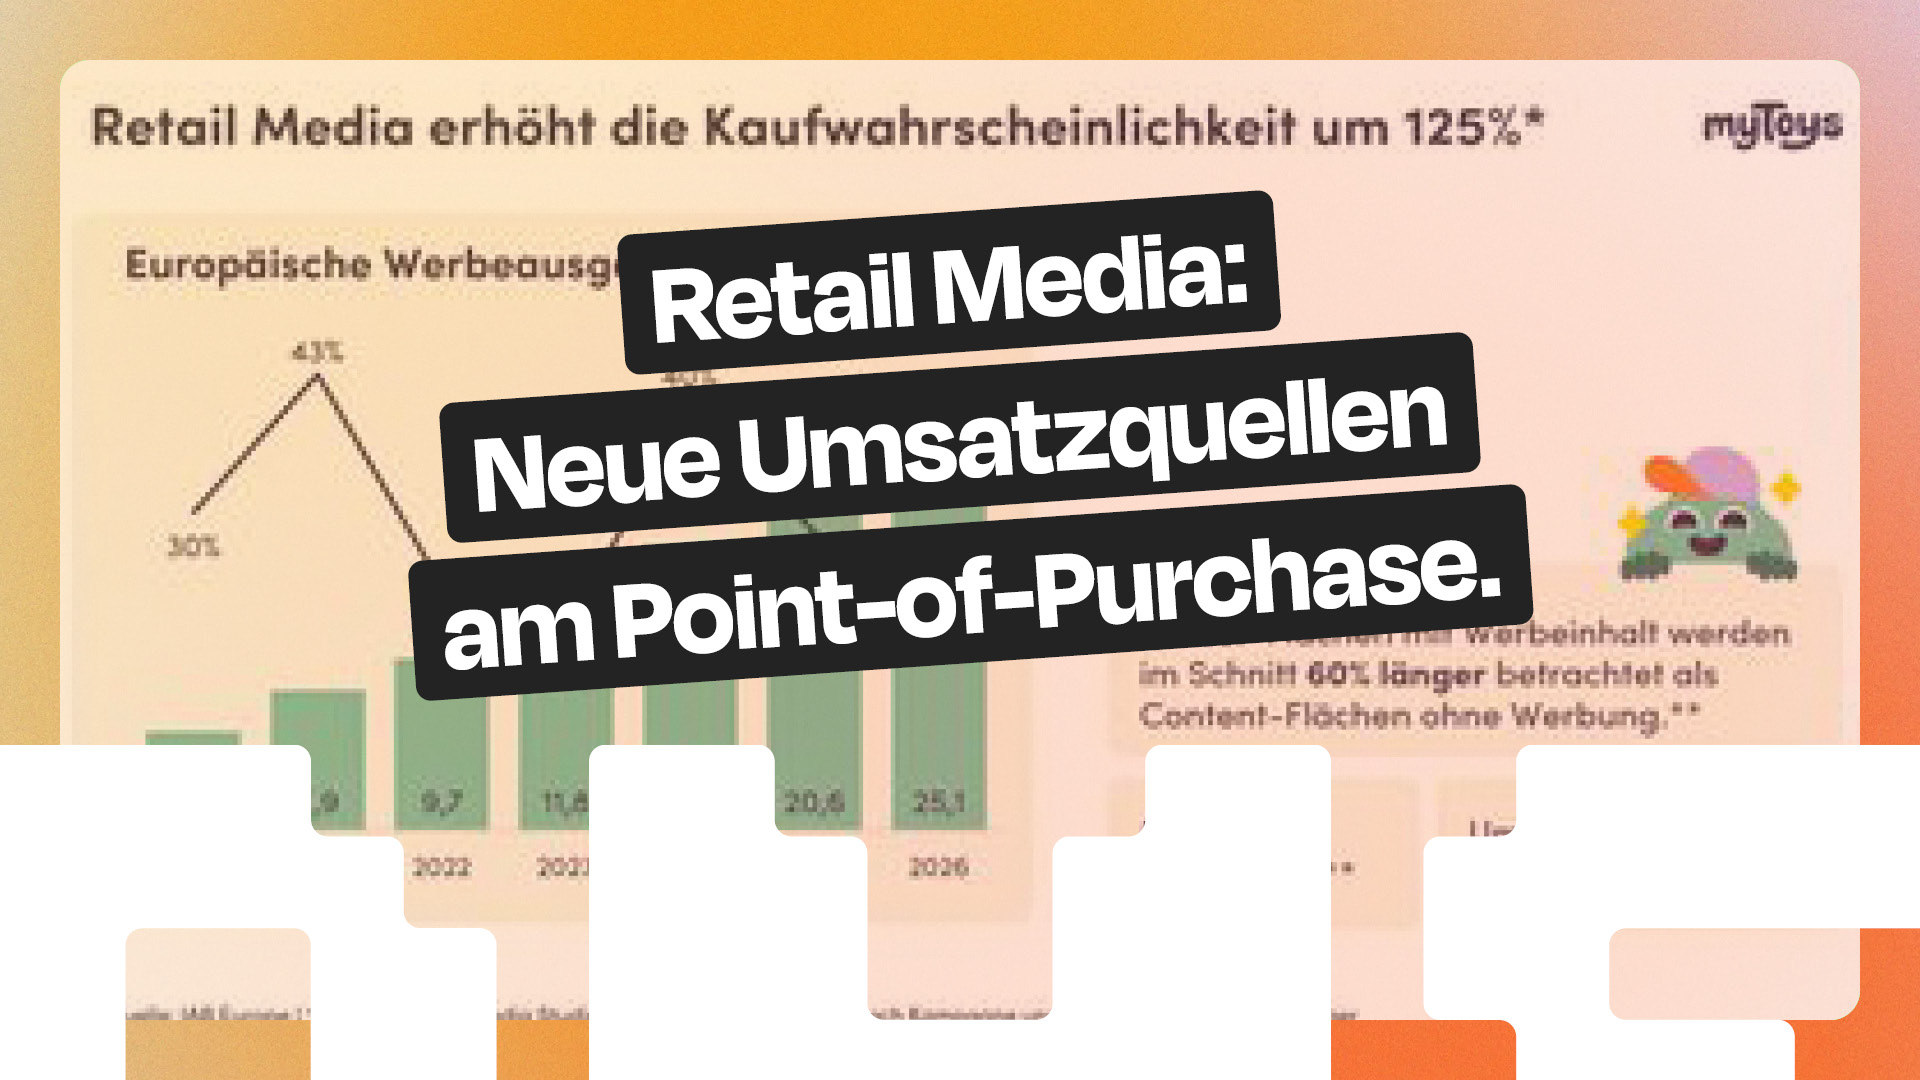
We are active in 19 metropolitan regions worldwide and focus on marketing at the point of sale – wherever customers are: online at home, on the move, or physically in-store.
The key question is:
How can marketing be optimized using location data and analytics?
Our work began with technical installations – including test operations in retail outlets. Today, we collaborate with major retailers and shopping centers such as Galeria Karstadt Kaufhof and the PAYBACK Group.
There, we can test and validate technologies live on-site.
Why Location Analytics?
I come from a customer relationship management and direct marketing background – that’s my professional DNA.
A core element is the customer journey:
Where does the customer come from? What are their interests? What do they do with the products they’re interested in or have purchased? What kind of service can we offer?
How many repeat customers do we have? How many new ones?
How does my customer base behave compared to competitors?
Today, these questions can be answered in real time – and, with some tools, even retrospectively for two to three years.
For example, we’ve conducted shopping mall analyses to see:
How did performance look before COVID?
When did foot traffic return to pre-pandemic levels?
How did customer behavior evolve compared to competitors?
This helps businesses understand their position and enables continuous optimization of marketing, product range, and location strategy.
Data Sources
In Austria, there are two main providers of anonymized mobile network data – A1 and Drei.
They supply movement data in grids of about 100–200 meters (sometimes as precise as 50 meters).
You can see where people spend time, where they live, work, and shop – all TÜV-certified and GDPR-compliant.
These datasets are enriched with sociodemographic data (age, household type, income, housing situation, etc.), enabling valid location analyses.
An example from the pandemic: lockdowns caused measurable drops in footfall, which can be visualized in heatmaps and time-series graphs.
Or you can use Sankey diagrams to analyze movement flows between locations.
Case Study: Vienna Airport
At Vienna Airport, a comprehensive location-based marketing infrastructure was implemented:
The Vienna Airport app (with a six-figure user base) serves as the foundation and was expanded with beacons and geofences.
This makes it possible to anonymously track movement patterns – for example, in parking areas, terminals, or shops.
Users are categorized into passengers, business clients, tenants, and employees.
Movements are visualized in heatmaps and help manage service offers in context –
for example, showing a parking ticket upgrade offer when a vehicle enters the airport premises.
Other Technologies
In addition to mobile data, traditional frequency counters (light barriers, cameras, infrared sensors), POS systems, digital signage, electronic shelf labels, and beacons all form part of a location analytics infrastructure.
Anything that measures interactions can provide data to better understand the point of sale.
These data enable:
- Adjustment of opening hours (e.g., depending on weather or events)
- Resource and staff planning
- Optimization of marketing campaigns
- Inventory and stock management
- Improved space productivity
This allows for both own-site and competitive analyses.
The key principle: measure, understand, improve – continuously.
Oliver Nitz:
Thank you, Thomas – great overview!
Based on your experience, what are the three biggest levers from these analyses?
Thomas Hinterleitner:
The biggest impact comes when analytical data is embedded into services – for instance, through CRM or loyalty programs, after-sales services, or product consultations.
Example:
A customer calls a service employee to their location via an interactive terminal. That increases service quality and efficiency.
A second lever is staff planning based on footfall – combining, for example, weather and holiday data.
And the third is strategic use of insights for location and investment decisions.
Oliver Nitz:
And how should someone new to the topic get started?
Thomas Hinterleitner:
By realizing that this is a strategic decision.
It requires openness to make processes measurable – even when results aren’t perfect.
Those who embrace this cultural shift gain clarity, efficiency, and transparency through data.
Oliver Nitz:
Jan, your turn – show us what your solution can do!
Jan Barenhoff (Placsense):
With pleasure!
We analyze precise GPS data, aggregated and GDPR-compliant, collected via smartphone apps (navigation, weather, news, etc.).
The data is anonymous but highly accurate (on a meter level).
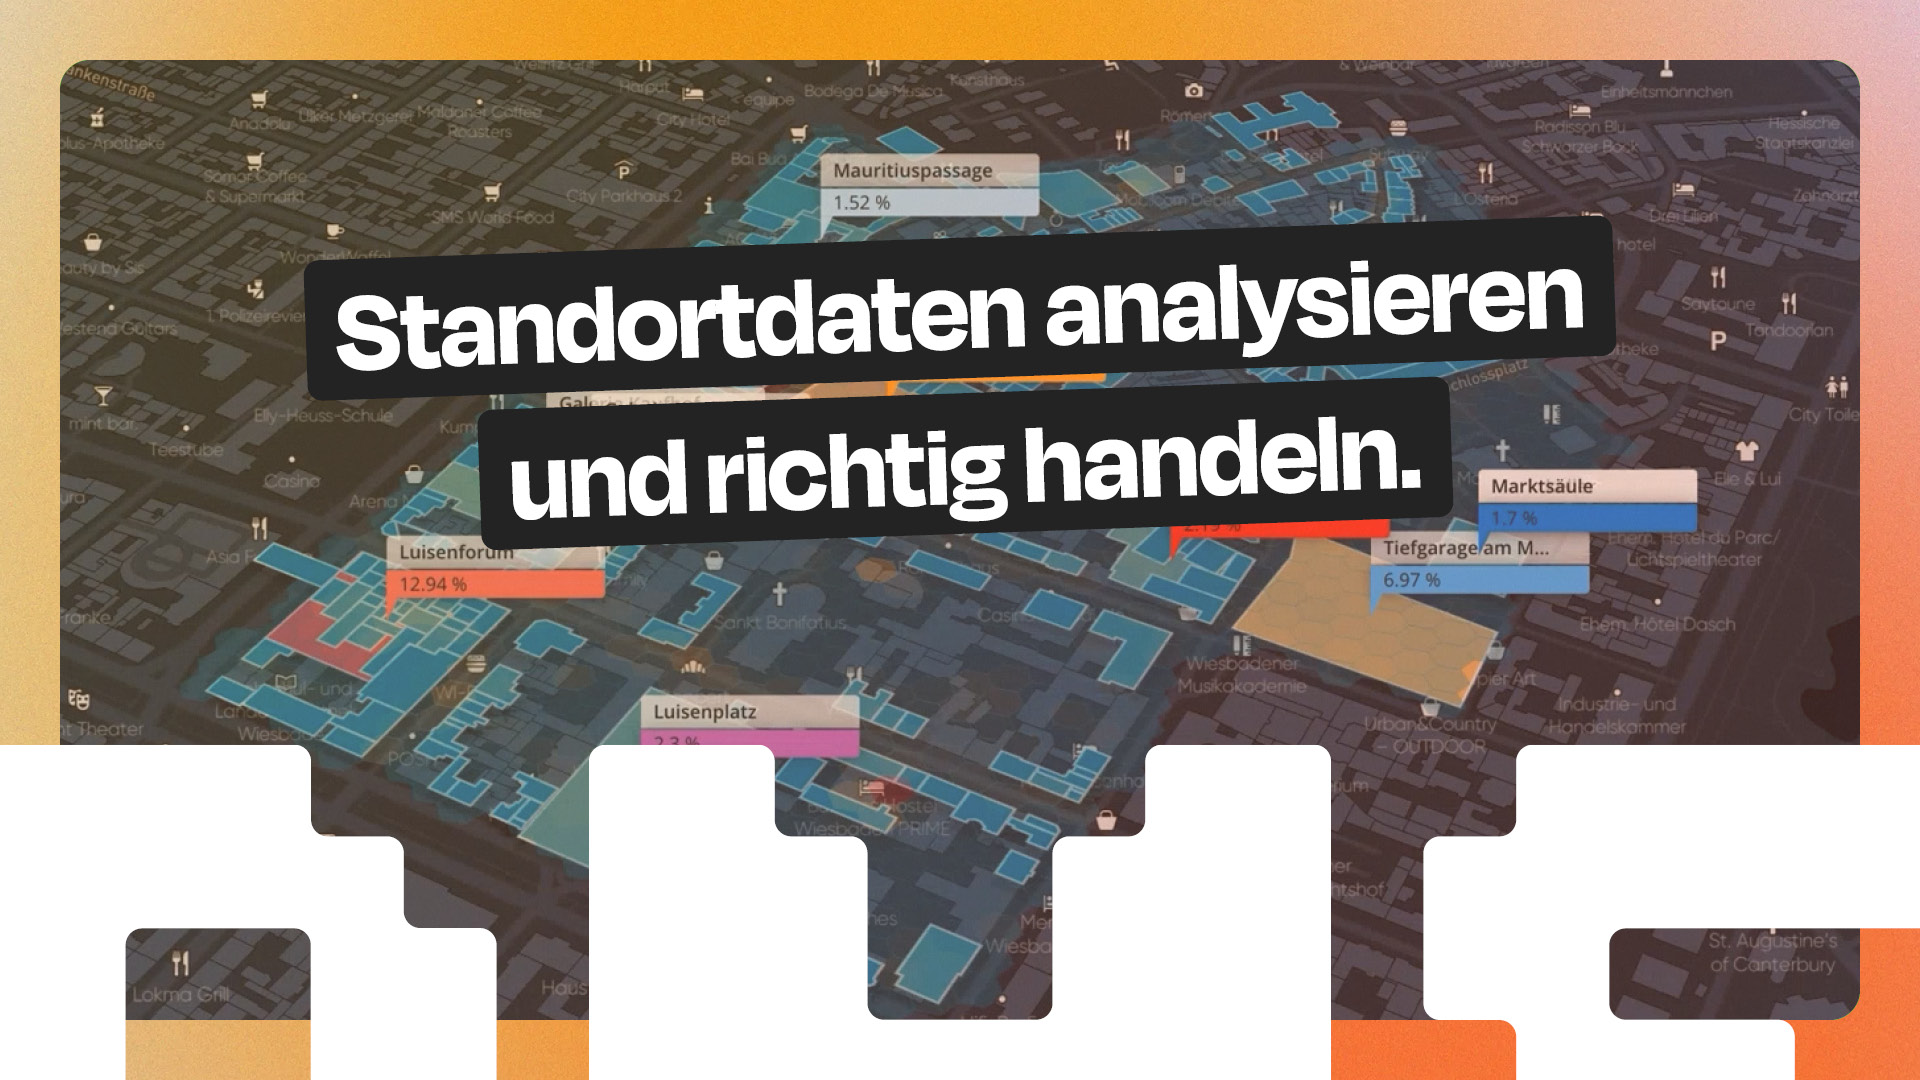
Example: Wiesbaden city center.
Our heatmap shows the main shopping axis and strongest footfall hotspots – including Karstadt and Galeria.
Case: Fashion Retail
We compared ZARA and Peek & Cloppenburg:
Footfall dropped during lockdowns ↓, then rose again.
By December 2022, it was almost back to pre-crisis levels.
In 2021, about 64% of ZARA visitors also visited P&C – in 2022, only 59%.
That shows: targeted actions can influence customer flows.
We can also analyze catchment areas, times of day, cross-visits, and sociodemographics – all historically traceable.
This is highly relevant for retailers, investors, city developers, and retail chains – anyone who wants to understand the customer journey in physical space.
Oliver Nitz:
Thank you, Jan – impressive. Can this also be applied internationally?
Jan Barenhoff:
Yes, absolutely. We analyze store networks across countries, including competitors, and help identify cross-visits or regional differences.
This allows data-driven control of campaigns, location decisions, and market entries.
Q&A and Closing
Oliver Nitz:
Are there any questions from the audience?
(…)
If there are no further questions:
The webinar recording will be available at digitale-medien.at/dms-talk.
There you’ll also find past Talks on topics such as Retail Innovation, Digital Signage, and Customer Experience.
The next DMS Talk will take place on March 21 – topic to be announced soon.
Many thanks to Thomas Hinterleitner and Jan Barenhoff, and of course to all participants.
Have a great evening!
More DMS Talks.